Plot Markers (ligo.skymap.plot.marker)
- ligo.skymap.plot.marker.earth = <matplotlib.markers.MarkerStyle object>
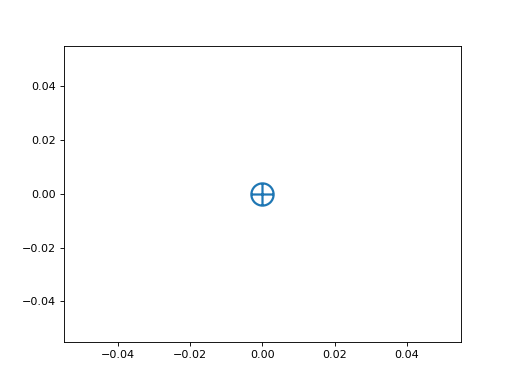
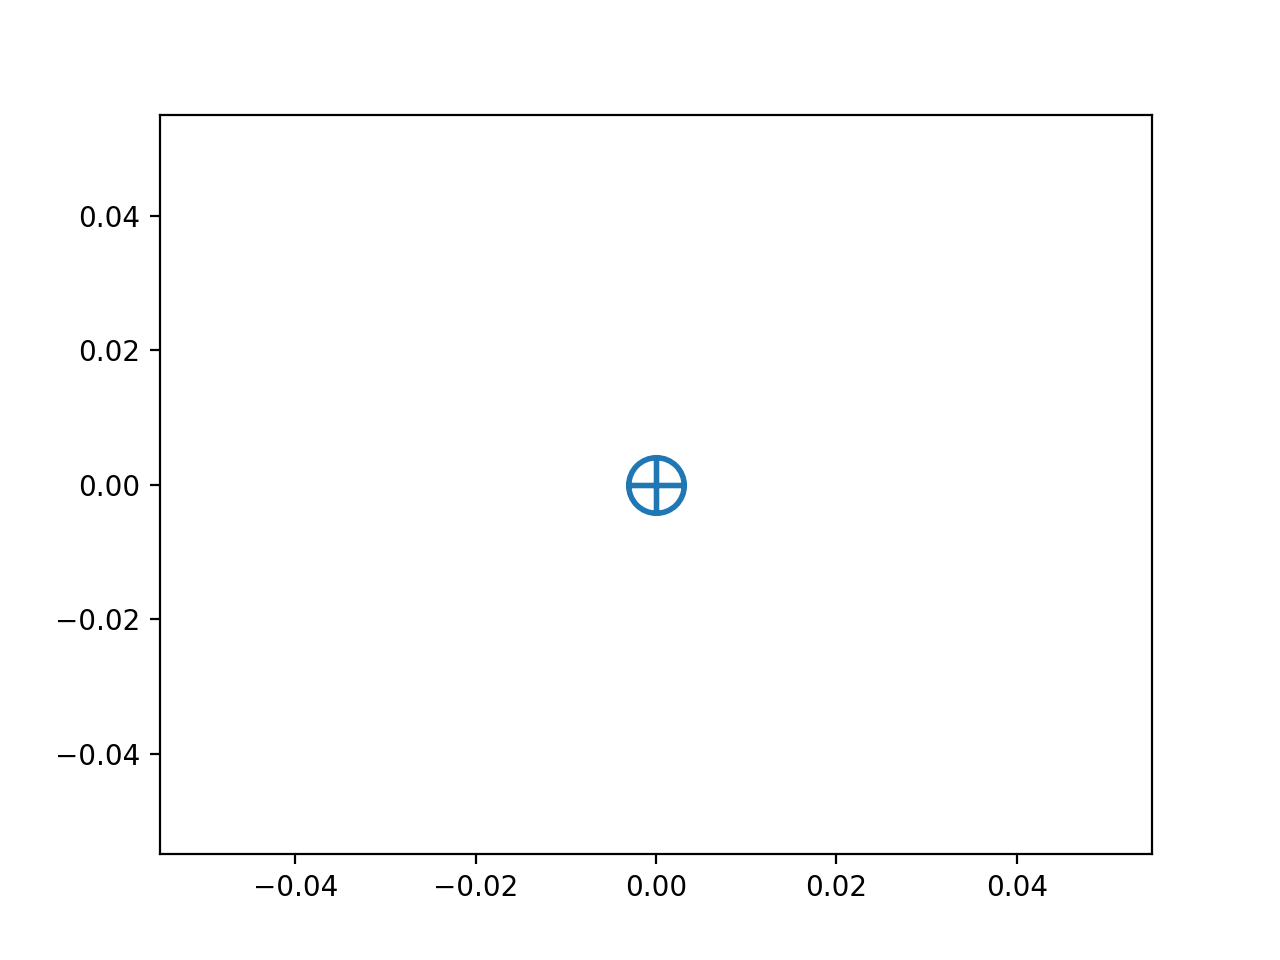
The Earth symbol (circle and cross).
Examples
from matplotlib import pyplot as plt
from ligo.skymap.plot.marker import earth

plt.plot(0, 0, marker=earth, markersize=20, markeredgewidth=2)
(
Source code,png,hires.png,pdf)
- ligo.skymap.plot.marker.sun = <matplotlib.markers.MarkerStyle object>
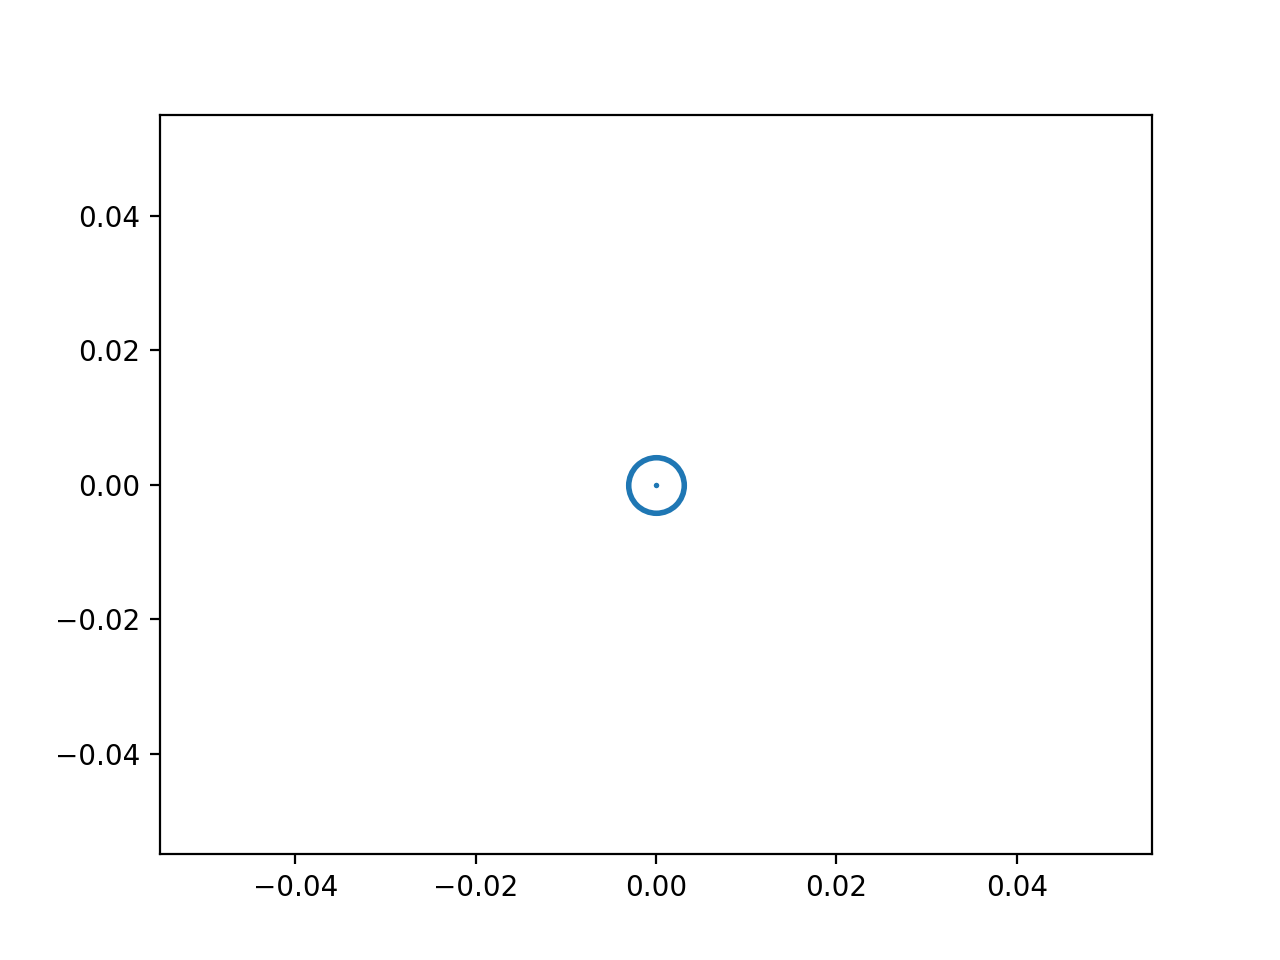
The Sun symbol (circle and dot).
Examples
from matplotlib import pyplot as plt
from ligo.skymap.plot.marker import sun

plt.plot(0, 0, marker=sun, markersize=20, markeredgewidth=2)
(
Source code,png,hires.png,pdf)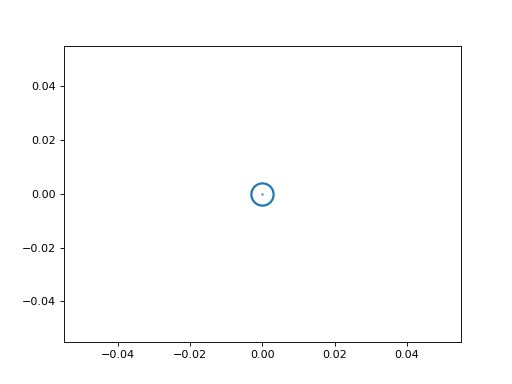
Specialized markers.
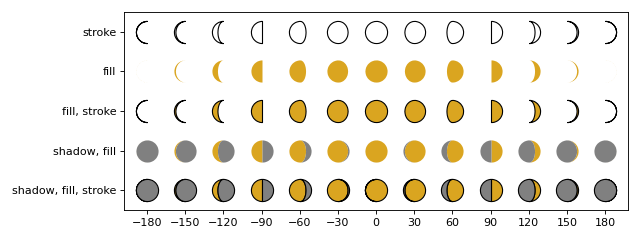
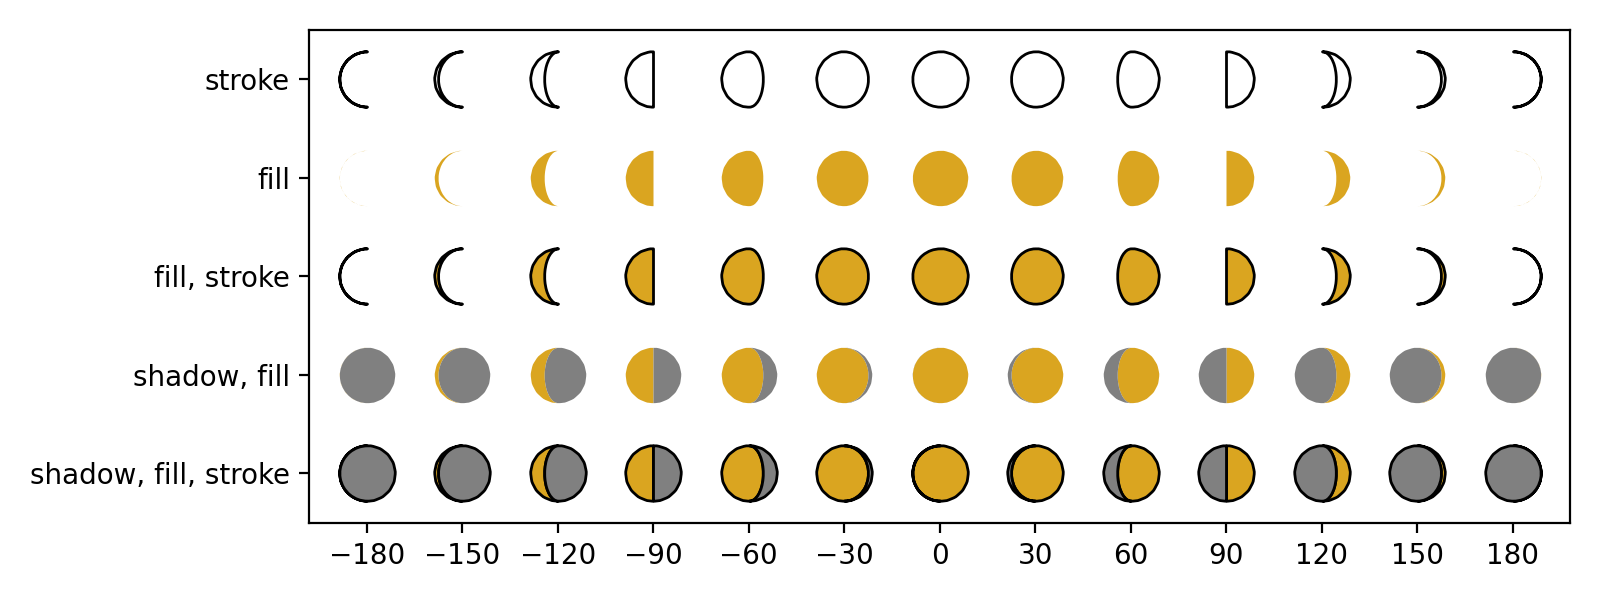
- ligo.skymap.plot.marker.moon(phase, shadow=False)[source]
Create a marker in the shape of the Moon.
- Parameters:
- phasefloat
Lunar phase in degrees between -180 and 180.
- shadowbool
If set, then the shadowed portion of the Moon is included in the marker, and its fill color can be set independently using the
markerfacecoloraltkeyword argument forplot()(see Marker fill styles).
- Returns:
- markerstylematplotlib.markers.MarkerStyle
Examples
from matplotlib import pyplot as plt
from matplotlib.ticker import MultipleLocator
import numpy as np
from ligo.skymap.plot.marker import moon

d_phase = 30
phases = np.arange(-180, 180 + d_phase, d_phase)

fig, ax = plt.subplots(figsize=(8, 3), tight_layout=True)
ax.xaxis.set_major_locator(MultipleLocator(d_phase))
for phase in phases:
    ax.plot(phase, 4, ms=20, marker=moon(phase, shadow=False), mfc="none", mec="black")
    ax.plot(phase, 3, ms=20, marker=moon(phase, shadow=False), mfc="goldenrod", mec="none")
    ax.plot(phase, 2, ms=20, marker=moon(phase, shadow=False), mfc="goldenrod", mec="k")
    ax.plot(phase, 1, ms=20, marker=moon(phase, shadow=True), mfc="goldenrod", mfcalt="gray", mec="none")
    ax.plot(phase, 0, ms=20, marker=moon(phase, shadow=True), mfc="goldenrod", mfcalt="gray", mec="black")
ax.set_yticks(
    [0, 1, 2, 3, 4],
    ["shadow, fill, stroke", "shadow, fill", "fill, stroke", "fill", "stroke"],
)
ax.set_ylim(-0.5, 4.5)
(
Source code,png,hires.png,pdf)
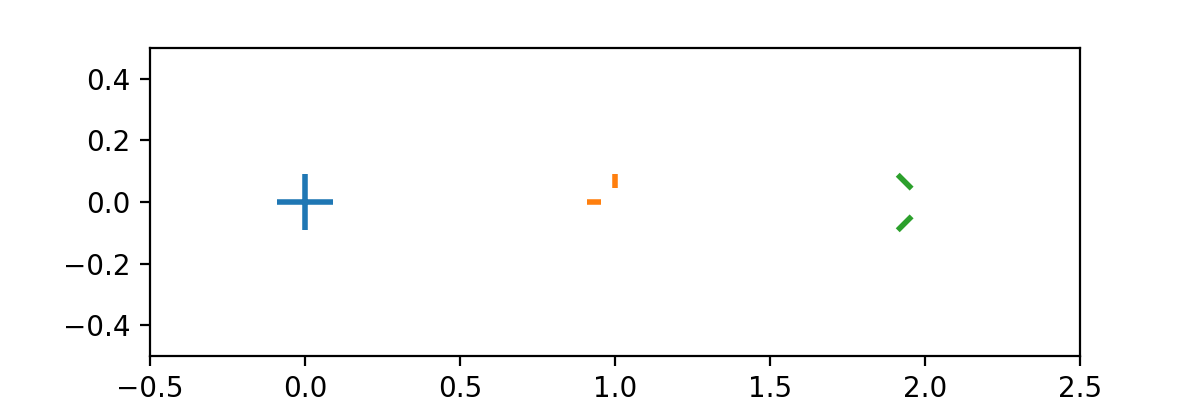
- ligo.skymap.plot.marker.reticle(inner=0.5, outer=1.0, angle=0.0, which='lrtb')[source]
Create a reticle or crosshairs marker.
- Parameters:
- innerfloat
Distance from the origin to the inside of the crosshairs.
- outerfloat
Distance from the origin to the outside of the crosshairs.
- anglefloat
Rotation in degrees; 0 for a ‘+’ orientation and 45 for ‘x’.
- Returns:
- path
matplotlib.path.Path The new marker path, suitable for passing to Matplotlib functions (e.g.,
plt.plot(..., marker=reticle()))
- path
Examples
from matplotlib import pyplot as plt
from ligo.skymap.plot.marker import reticle

markers = [reticle(inner=0),
           reticle(which='lt'),
           reticle(which='lt', angle=45)]

fig, ax = plt.subplots(figsize=(6, 2))
ax.set_xlim(-0.5, 2.5)
ax.set_ylim(-0.5, 0.5)
for x, marker in enumerate(markers):
    ax.plot(x, 0, markersize=20, markeredgewidth=2, marker=marker)
(
Source code,png,hires.png,pdf)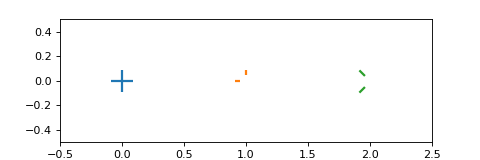